When it comes to high-tech, computers, and especially graphics, benchmarks play a crucial role. After purchasing and assembling all the components and setting up a new desktop, running benchmarks becomes a key step in assessing the system performance.
Given that graphics cards are among the most expensive desktop components, these tests provide a clear and objective evaluation of the graphics or system’s overall capabilities, which is essential when validating the setup. This is particularly important for 3D artists, gamers, and video production enthusiasts who rely heavily on the graphics capabilities.
As the name implies, graphics benchmarks are designed to evaluate the performance of the graphics processing unit (GPU), regardless of other components in the system. However, other parts of the system can sometimes affect the results. For instance, if the system has an outdated central processing unit (CPU), the benchmark results may be limited by the CPU’s processing power, even if the GPU is capable of much more.
Today, there are several graphics benchmark providers on the market, one of which is GPUScore. In all of our benchmarks, including our latest ray tracing benchmark, Breaking Limit, we use frame-based rendering as the default rendering technique. This method measures performance by calculating the time the GPU takes to render each frame of a given workload. The result is determined by dividing the total number of frames rendered by the time taken to render them.
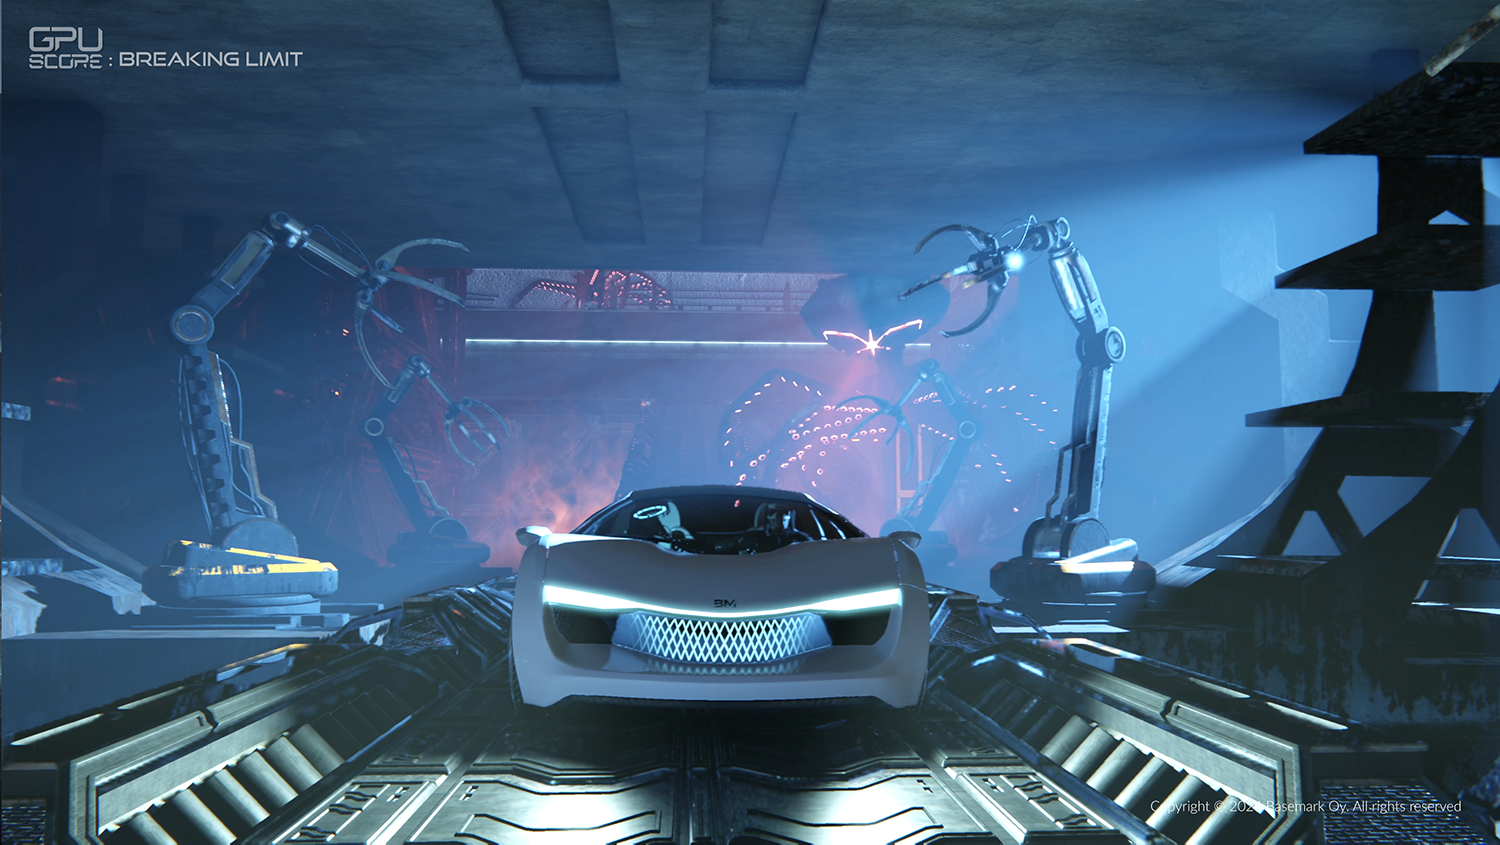
Breaking Limit: Our Latest GPU Benchmark
Real-time ray tracing is becoming increasingly common in both games and other graphics-intensive applications. Today, a wide range of devices support ray tracing, all the way from discrete GPUs to embedded smartphone chipsets.
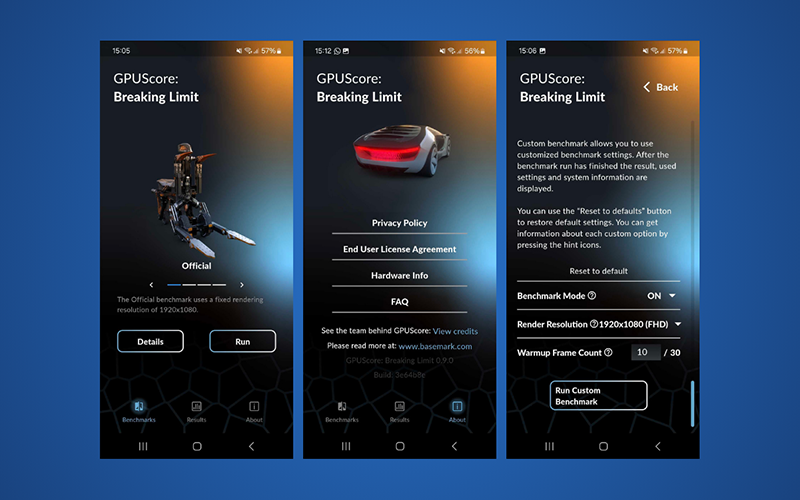
Image text: Breaking Limit smartphone interface
Breaking Limit is the latest benchmark released by GPUScore and, at the time of writing this blog post, the newest graphics benchmark available on the market. It is a cross-platform ray tracing benchmark designed to assess the performance of GPUs across smartphones, tablets, laptops, and desktops. Breaking Limit runs on all major operating systems, including;
- Windows
- Android
- iOS
- Linux
In the near future, it will also be available for macOS and Windows on ARM.
Breaking Limit measures the GPU performance by running a complex 3D scene that replicates game-like content. What makes Breaking Limit unique is its consistent workload across all devices, allowing for accurate comparisons between laptops, smartphones, and desktop systems. With Breaking Limit, you can directly compare the performance of ray tracing-capable smartphones against desktop systems side by side. This means that you can compare your smartphone performance in relation to your desktop.
Additionally, Breaking Limit includes a heavier workload called Breaking Limit Ultra, designed specifically for desktop systems and GPUs. The demanding workload includes additional ray tracing effects and two upscaling tests. Breaking Limit Ultra is compatible with both Windows and Linux systems.
Technical insight on Breaking Limit
Breaking Limit is designed to run on devices capable of real-time ray tracing. Thus, it’s important to note that “real-time ray tracing” often refers to a hybrid approach combining ray calculations with rasterization.
Breaking Limit incorporates commonly used ray tracing effects found in games, including real-time reflections, shadows, and global illumination. Due to its high demand on system resources, global illumination is only featured in the Ultra workload.
The main workload uses three ray-traced shadow-casting lights while Breaking Limit Ultra uses eight. Despite employing Level of Detail (LOD) optimization in both workloads, the benchmark’s intensity arises from the complexity of geometry and ray tracing calculations per frame.
To ensure objective and precise evaluations, Breaking Limit consistently provides the GPU with identical frames throughout the benchmark. The result is determined by dividing the total time by the number of frames, rather than measuring how many frames can be rendered in a given time. This method guarantees repeatability and consistency, avoiding issues such as frame skipping, Vertical Sync (V-Sync) capping, or other inconsistencies.

Image text: Example of how the benchmark experience looks like to avoid V-sync capping
V-Sync capping is avoided by updating the main window every ninth frame while keeping the other eight frames as thumbnails in a filmstrip-like display. This technique ensures all frames are rendered regardless of potential V-Sync limitations, which can otherwise restrict the output of high-performance GPUs.
Breaking Limit Performance Analysis
In this section, we present an analysis of the Breaking Limit results submitted to the Powerboard. All benchmark scores are automatically added to the Powerboard, except for those generated using a commercial license, where submitting the score is optional. The data reviewed here is based on results retrieved as of September 12, 2024. Any scores submitted after this date are not included in the analysis.

Image text: GPUScore Powerboard platform
How are the benchmark scores calculated?
The benchmark score is determined by multiplying 100 by the average frame rate, rounded to two decimal places. This produces a straightforward integer score. Unlike some other benchmark products, no artificial formulas or subjective weighting of test results are used. A higher score indicates better performance.
Cross-device comparison
Breaking Limit allows you to do side-by-side device comparisons. By filtering the public results displayed on the Powerboard, we can generate charts that illustrate these comparisons. Below you find a chart of top scores per device category.

Image text: Cross-device comparison chart showing top-performing devices.
The best results on smartphones seem to belong to the iPhone 16 Pro with Apple’s A18 Pro processor and on tablet iPad 12.9 inch 3rd Gen with M3 Max chipset. The desktop GPUs and laptops seem to be dominated by NVIDIA’s RTX 4090 and Asus ROG Series, which both use the RTX 4090.
We can still see a notable difference between the performance on desktop GPUs and smartphone processors. Although ray tracing capable smartphones are available on the market today, their performance still has some way to go before it can be compared to the performance of laptops, desktops, and even tablets. Typically, new advancements are first introduced on desktops and laptops before being adapted for smartphones.
Smartphone comparison
When looking closer at the scores for smartphones for the Official test, which employs a standard 1920×1080 resolution, the results look like this:
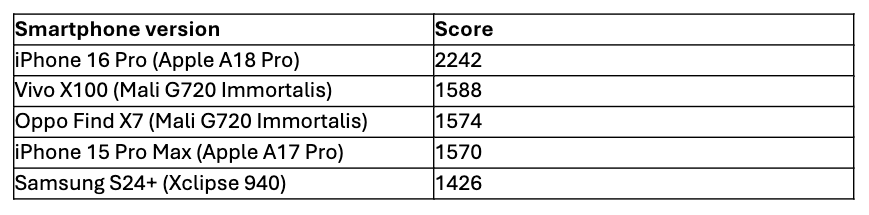
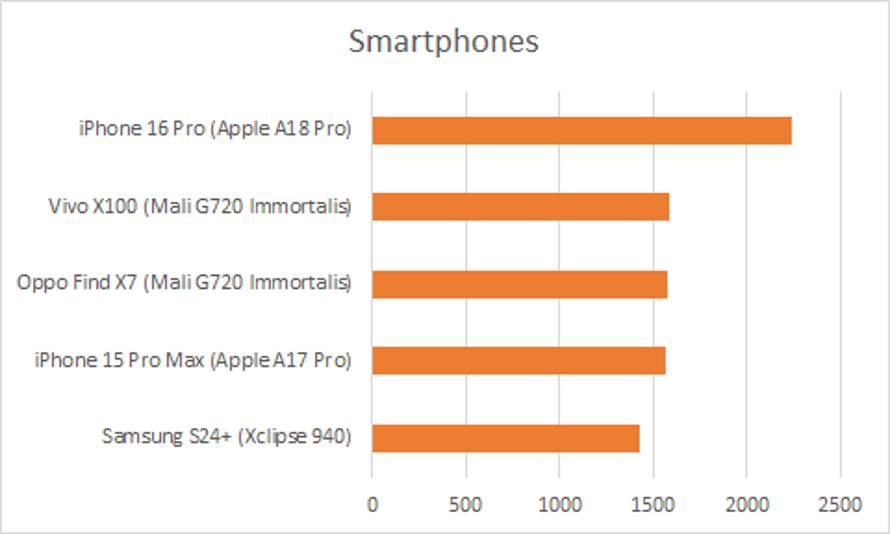
Image text: Smartphone performance with standard resolution
We can see the iPhone 16 Pro with Apple’s A18 Pro GPU at the top, followed by the Vivo X100 and Oppo Find X7, equipped with Immortalis G720 processors. The Samsung S24+ is still ranking high, with its XClipse 940 chipset. We can observe that the new generation of smartphones performs significantly better than the older generation smartphones. It’s no surprise that devices released throughout 2024 are indeed dominating the performance charts.
Smartphone comparison based on native resolution
The Official Native test mode of Breaking Limit is a special kind of test that renders the content using the device’s native resolution. Or, in other words, the highest resolution for which the device performs at its best.
Since the ‘native’ resolution differs for each device, the results are no longer comparable as such, but instead reveal the device’s actual performance as intended by its manufacturer.


Image text: Smartphone performance comparison native VS standard resolution
As expected, this test shakes up the order a bit compared to the Official test mode since each device has its own performance settings, and native resolution is one of the key factors. The gap between the standard resolution test result, and the native test one, shows the actual difference in performance when using the phone’s own/optimal settings.
GPU comparison
Given the complexity of Breaking Limit, it is also interesting to evaluate the performance of leading GPU models across various environments. The graph below illustrates the highest performance results displayed on the Powerboard for each device type:
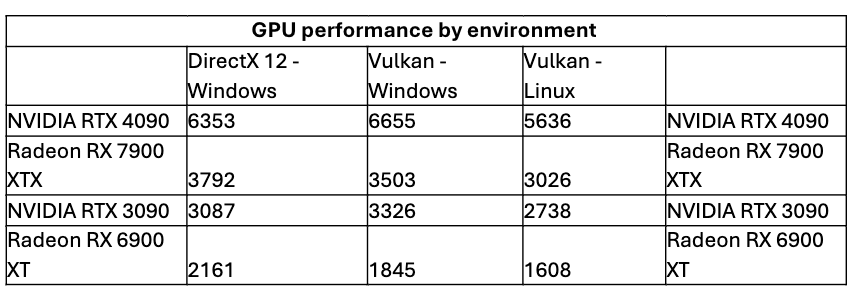

Image text: GPU performance comparison by environment
The Nvidia RTX 4090 consistently ranks as the top performer across all environments, while the Radeon RX 7900 XTX secures second place.
Check out some of the results
If you want to dive a bit deeper into the results from Breaking Limit, it’s also worth checking the analysis made by leading hardware review sites. Here are some of our top picks:
- PC Gamer | There’s a new ray tracing benchmark in town and it paints an all-too-familiar picture of today’s GPUs
- WCCFtech | Basemark “Breaking Limit” Ray Tracing Benchmark Now Out, Tested With NVIDIA, AMD & Intel GPUs
- Phoronix | AMD vs. NVIDIA Vulkan Ray-Tracing Performance On Linux With Breaking Limit
Wrapping up
Breaking Limit offers a comprehensive view on the current state of the ray tracing market, going beyond evaluating just desktop GPUs. It is an extensive benchmark that enables detailed analysis and comparison across various environments, components, devices, and entire systems.
Given the current state of the market, it will be interesting to see how the technology evolves. Will the gap between smartphones and desktop GPUs stay the same? Will differences among device brands increase or decrease? Will some GPUs favor one API over another? Only time will tell if these trends hold or if new limits are going to be broken…
